
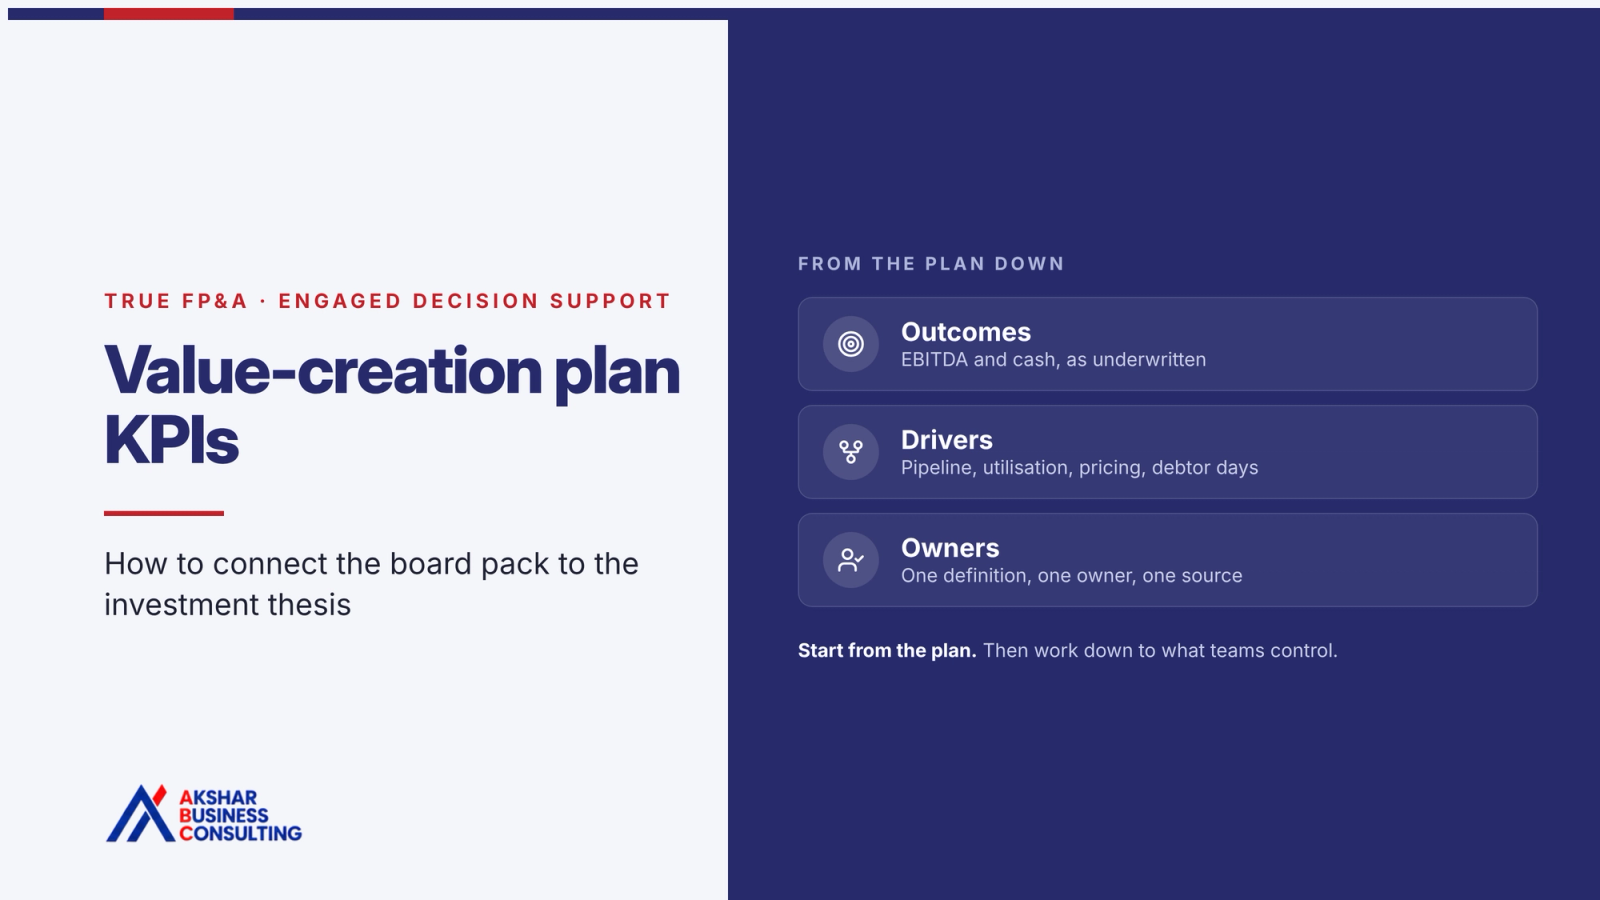
Your sponsor bought a thesis. In a lot of PE-backed businesses, the board pack still measures the business they bought.
The thesis is specific: a revenue mix, a margin bridge, a cash profile, a route to exit. The KPI set is usually older. It was built for a previous owner, added to every time someone asked a new question, and rarely redesigned. So every month, someone at the board table has to translate what Finance reports into what the plan needs.
I wrote about how to spot that gap in Your KPIs Were Built for the Previous Owner. This piece is the practical follow-on: how to build value creation plan KPIs, step by step, so the board pack measures the thesis directly.
Why KPI frameworks drift from the plan
KPI frameworks rarely go wrong in one go. They drift. A new measure gets added for a lender, another for a division head, another after a difficult board meeting. Very few are ever taken out.
Meanwhile the value-creation plan moves on. An acquisition changes the group, a new CFO arrives, the priorities shift. Without a deliberate link between the plan and the KPIs, the two separate quietly, and the board starts asking for measures Finance can't produce.
Step 1: start from the plan, and build a KPI tree
Begin with the outcomes the sponsor underwrote, usually EBITDA and cash, and work down. For each outcome, ask what drives it. Then ask what drives that, until you reach measures a team can act on within a week.
For a services business, an illustrative tree might run like this:
- EBITDA breaks down into revenue, gross margin and overheads
- Revenue breaks down into new bookings and retention
- Bookings depend on pipeline coverage and win rate
- Gross margin depends on utilisation and pricing
- Cash depends on debtor days, overdue invoices and the timing of capex
[image]
Image 1 · An illustrative KPI tree for a services business
The tree does two jobs. It shows which operational measures actually move the plan, and it exposes the KPIs in your current pack that don't connect to anything. Those are candidates for the appendix, or for retirement.
Step 2: choose a mix of outcome, driver and control KPIs
Outcome KPIs tell the board where the business has landed. Driver KPIs show what's moving those results. Control KPIs show whether the numbers can be relied on, such as forecast accuracy or open data issues.
Most packs are heavy on outcomes. Make sure the drivers are there too, and that some of them look forward. My rule of thumb is that at least a third of the framework should help predict next quarter. Pipeline coverage, utilisation and overdue invoices all tend to move before the results they drive.
Step 3: give every KPI one definition, one owner and one source
This is where most frameworks fail in practice. If Sales, Finance and Operations each calculate revenue differently, the first ten minutes of every board discussion go on whose number is right.
For each KPI, write down:
- The formula, and the source system it's calculated from
- Who owns the definition, and who is accountable for performance
- The target, and the threshold at which management needs to act
- The date the definition took effect, so any change is documented
At Synamedia, a global video software business that was Permira-backed at the time, the case study describes the core problem as “the absence of a common performance language across the business.” Once KPIs, reporting cycles and cross-business measures were standardised, key reporting outputs that had taken two to three weeks to collate and synchronise could be generated in minutes.
Step 4: check the data can support each measure
A KPI that can't be calculated reliably won't survive the first board question. Before you commit to a measure, check where its data comes from and whether that data is complete.
One PE-backed technology services group pursuing a buy-and-build strategy already had a documented KPI book. Of its 38 KPIs, 18 could be calculated from systemised data. The rest needed changes to how data was captured or to the processes behind it. Lost opportunities, for example, could keep a future close date, which distorted both the reported pipeline and its timing.
The group put those 18 measures live, connected finance, billing, CRM, HR and project data, and set out a roadmap for the remaining 20. Pipeline exceptions now have a named owner. In the case study's words, data quality stopped being a finance complaint and became a sales routine.
Step 5: set the reporting rhythm
A KPI that arrives three weeks after month-end describes a period the board can no longer change. Aim to report the full set within five working days of the close, with commentary that explains the driver behind each material movement.
A useful test: when a KPI moves, can the business explain the underlying driver within 24 hours? If it takes a week, the problem is usually definitions, ownership or a drill path that stops at the summary line.
What value creation plan KPIs look like in the board pack
In a pack built this way, the first KPI page is the plan, measured: the revenue mix the deal underwrote, the margin bridge, cash, and the leading indicators for next quarter, each with an owner. The sponsor stops translating, and the discussion moves to what needs to happen next.
This is Engaged Decision Support in TRUE FP&A: KPIs tied to the value-creation plan and the decisions that move it. It depends on Trusted Data underneath, and it becomes far more useful when the forecast can flex (Responsive Planning) and the pack arrives in time to act on (Up-to-date Insights).
Where to start
You don't need to rebuild everything at once. Map your current board KPIs against the plan, and move anything that doesn't connect to the appendix. Then fix definitions and owners for the measures that remain, check the data behind each one, and add the leading indicators you're missing.
The KPI Alignment Audit scores your framework against ten checks, from the investment thesis link to exit narrative readiness. And if you'd rather talk it through, a Board Readiness Review is a confidential 30-minute conversation about where to start.
How many of your board KPIs would survive being mapped to the plan?
Frequently asked questions
What are value creation plan KPIs?
They are the measures that show whether a PE-backed business is delivering the plan its investors underwrote. They usually start with EBITDA and cash and run down to the operational drivers teams control, such as pipeline coverage, utilisation, pricing and debtor days.
How many KPIs should a board pack have?
Usually fewer than it has today. A focused set the board can interrogate is more useful than a long list nobody reads. Each KPI should link to the plan, have one definition and one owner, and support a decision. At least a third should help predict next quarter.
What is the difference between leading and lagging KPIs?
Lagging KPIs, such as revenue and EBITDA, report results that have already happened. Leading KPIs, such as pipeline coverage or utilisation, tend to move first, which gives management time to act before the result lands.