

The board asks a fair question: what happens to profit and cash if utilisation drops from 75% to 70% next quarter?
Finance has a forecast. What it does not have is a forecast that knows utilisation exists. Revenue sits in the model as a monthly number, grown from last year by a percentage agreed in January. So the answer means rebuilding the revenue line by hand, reconciling it back to the pack and returning to the board three days later, by which point the conversation has moved on.
That gap, between the question the board asks and the shape of the model Finance owns, is what driver-based forecasting closes. This guide covers what it is, how to build one without building a monster, and the five mistakes I see most often.
What driver-based forecasting is
Driver-based forecasting builds the forecast from the activities that produce the numbers, rather than from the numbers themselves.
A driver is an operational or commercial measure that moves a financial line: billable headcount, utilisation, day rates, customer numbers, churn, contract start dates, debtor days. You forecast the drivers. The model calculates revenue, cost, EBITDA and cash from them, through relationships everyone can see.
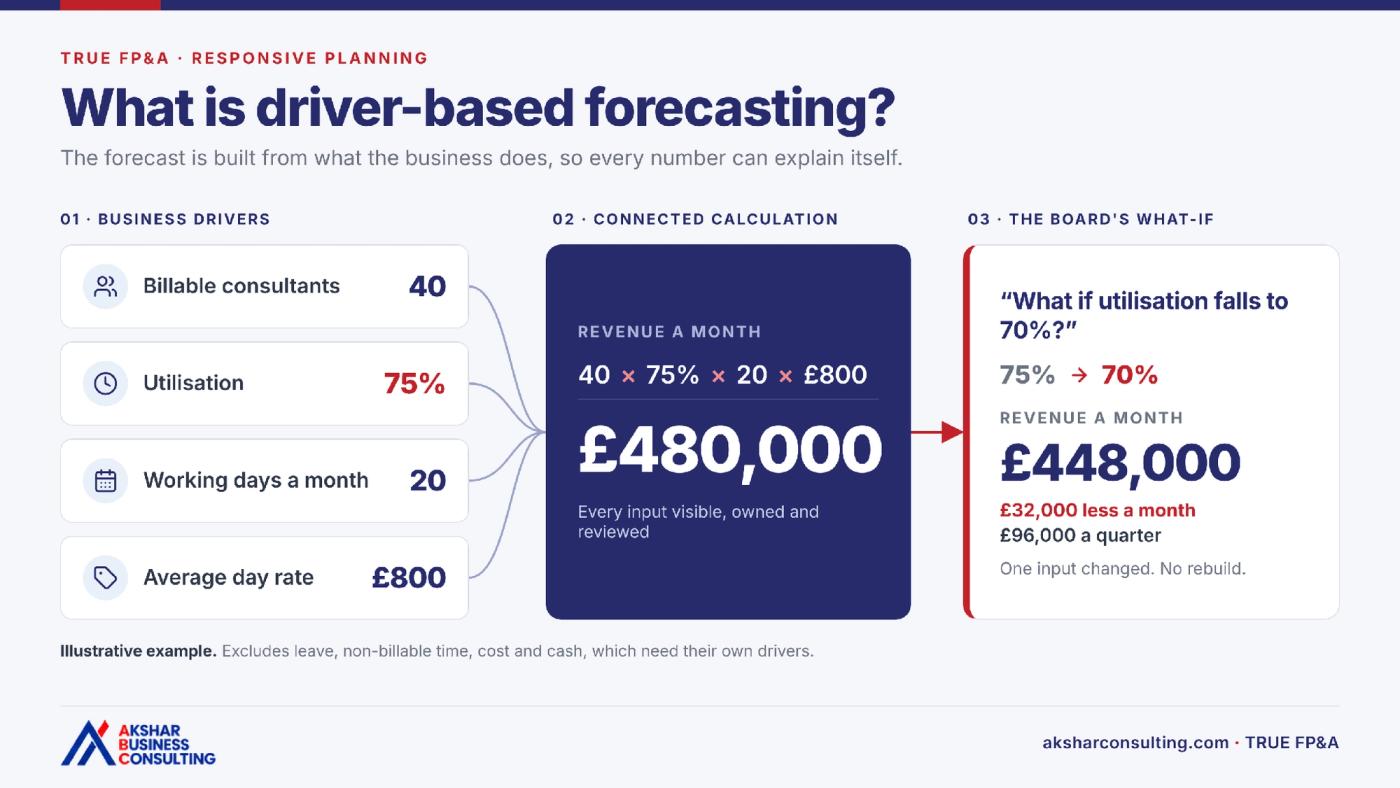
A professional services business might forecast revenue from billable consultants, utilisation, working days and average day rate. A subscription business might use opening customers, new sales, churn and average revenue per customer. The drivers differ. The principle does not: build the forecast from the things the business actually controls and measures.
How it differs from a traditional forecast
A traditional forecast usually starts from last year's actuals and adjusts them: growth here, inflation there, a management overlay where something is known. For stable lines such as rent, insurance and most overheads, that is perfectly sensible. Modelling them in detail adds effort and no insight.
The difference shows up when someone asks why. A forecast built from a percentage uplift can tell you what revenue will be. It cannot tell you whether that number depends on hiring six people by March, or on holding a day rate the market is already pushing back on.
This is not a rare weakness. In our 2025 FP&A Reality Gap research, 16 of the 19 senior finance leaders we interviewed were running models built for an older environment. Only 2 were using genuinely driver-based models. The rest could hit a number but could not explain the movement behind it, and every scenario meant a manual rebuild.
A Group Head of FP&A at a global industrial business of around £1.5bn described the pattern in one sentence:
“In the last four years we've had more chaos than in the last 30 to 40 years, and we've stayed in the mindset that just predicts an answer. We haven't moved into scenarios, risks, opportunities.”
Group Head of FP&A · Global industrial · confidential interview, 2025 FP&A Reality Gap Report
You do not have to choose one method. The best forecasts I see are hybrids: drivers where activity moves the number, trend-based assumptions where it does not.
Why it matters in a PE-backed business
Private equity boards rarely stop at what revenue will be. They ask why it is moving and what you are going to do about it. If the forecast cannot answer, the CFO loses the right to shape that conversation.
A driver-based model changes four things.
Variances become explainable. A revenue shortfall stops being one number and becomes a utilisation problem, a pricing problem or a timing problem. Each leads to a different conversation, and a different owner.
Scenarios become questions you can answer. Decisions arrive as events, not percentages: a hire brought forward, a price rise held back, a contract that slips. When those events are inputs, Finance can test them without rebuilding the model each time.
Operations owns its part of the forecast. Operational leaders know the activity. Finance knows what it means financially. Shared drivers give both sides the same language, and make it obvious who owns which assumption.
Cash stops being an afterthought. Revenue and EBITDA can look healthy while cash tightens because customers are paying later. Debtor days, supplier terms and capital expenditure belong in the model as drivers too.
How to build a driver-based forecast
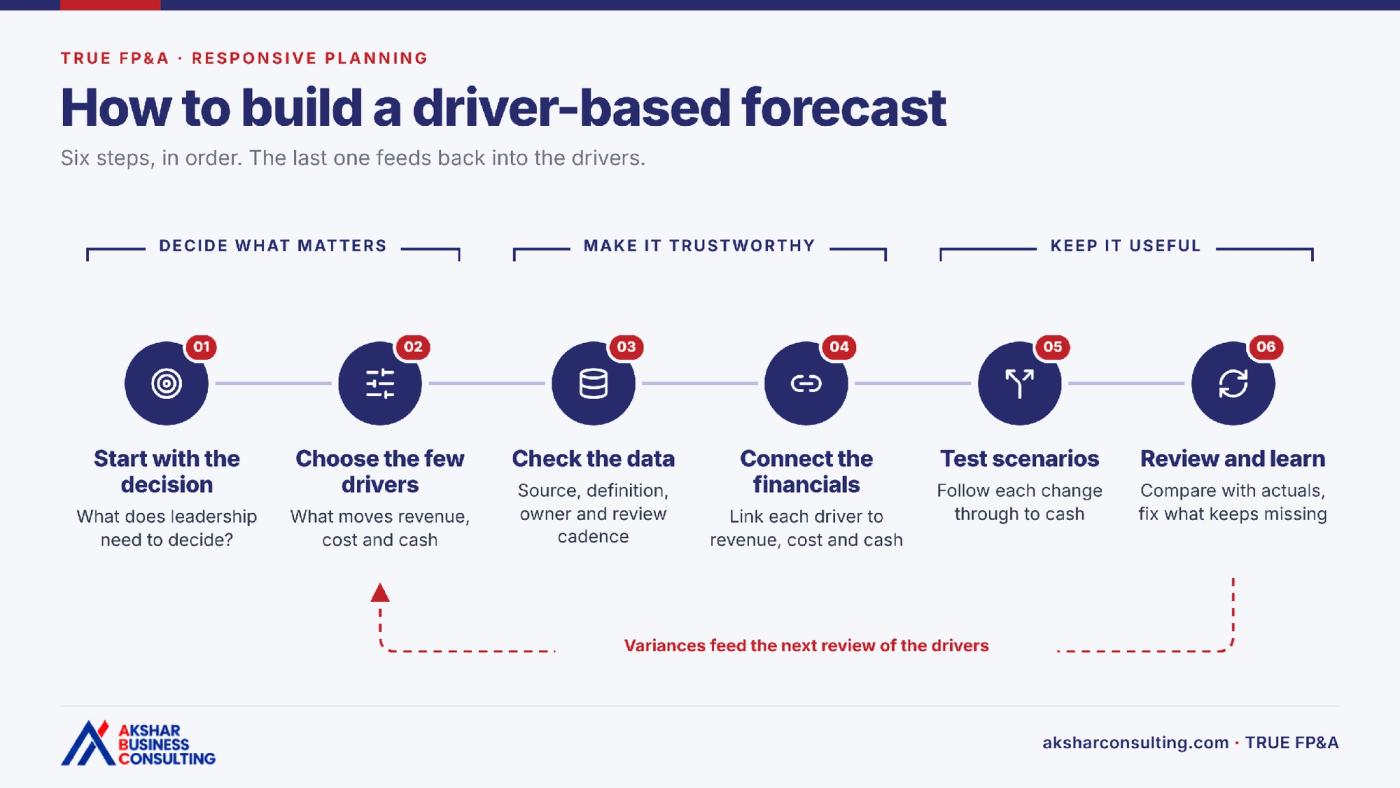
Start with the decision, not the model. Everything else follows from it.
1. Start with the decision the forecast must support
Write down the questions leadership actually asks. Can we afford to bring hiring forward? What happens to cash if our largest client pays at 75 days instead of 45? What does a five-point drop in utilisation do to the quarter?
Those questions tell you which drivers matter and which outputs the model must produce. Skip this step and you build something detailed, expensive to maintain and unable to answer the board's next question.
2. Choose the few drivers that move the numbers
Pick the drivers that move revenue, cost and cash materially, and that someone can measure or reasonably estimate.
- Revenue: billable headcount, utilisation, day rates, customer numbers, contract start dates
- Cost: headcount and salary, recruitment timing, subcontractor spend
- Cash: debtor days, supplier terms, capital expenditure
Fewer is better. If a driver would not change a decision, leave it out.
3. Check the data, and give every driver an owner
A driver-based forecast is only as good as the inputs feeding it. If Finance counts headcount one way and Operations another, the model will give a precise answer to the wrong question.
For each driver, agree four things: its source, its definition, its owner and how often it is reviewed. This is unglamorous work. It is also where most of the value sits, and it costs far less than a new platform.
4. Connect the drivers to the financials
Illustrative example. Assumptions first: a professional services business with 40 billable consultants, 75% utilisation, 20 working days a month and an average day rate of £800.
40 × 75% × 20 × £800 = £480,000 a month
Drop utilisation to 70% and monthly revenue falls to £448,000. That is £32,000 a month, or £96,000 a quarter, from a five-point change in one driver.
What this does not show: leave, non-billable time, contract terms and the timing of work, all of which a real model needs. It also says nothing about cost or cash, which need their own drivers. The point is narrower. Once revenue is built from drivers, the board's utilisation question becomes a change to one input rather than a rebuild.
5. Test scenarios before the decision is made
A base case is one view. The board needs to see the alternatives while the decision is still open.
Change the driver, then follow it all the way through. If utilisation falls, can recruitment slow down, or is that headcount already committed? Which costs fall with activity and which stay put? What happens to cash in the months after, not only the month itself? A scenario that only moves revenue is not a scenario. It is a sensitivity.
6. Review it, and learn from the variances
A driver-based forecast is a process, not a file. Refresh actuals on an agreed cadence, review the assumptions with their owners, explain the variances and approve material changes before they reach the board.
Then compare the forecast with what actually happened. That comparison is the most useful feedback the model will ever get. It tells you which assumptions you keep getting wrong.
Five mistakes I see most often
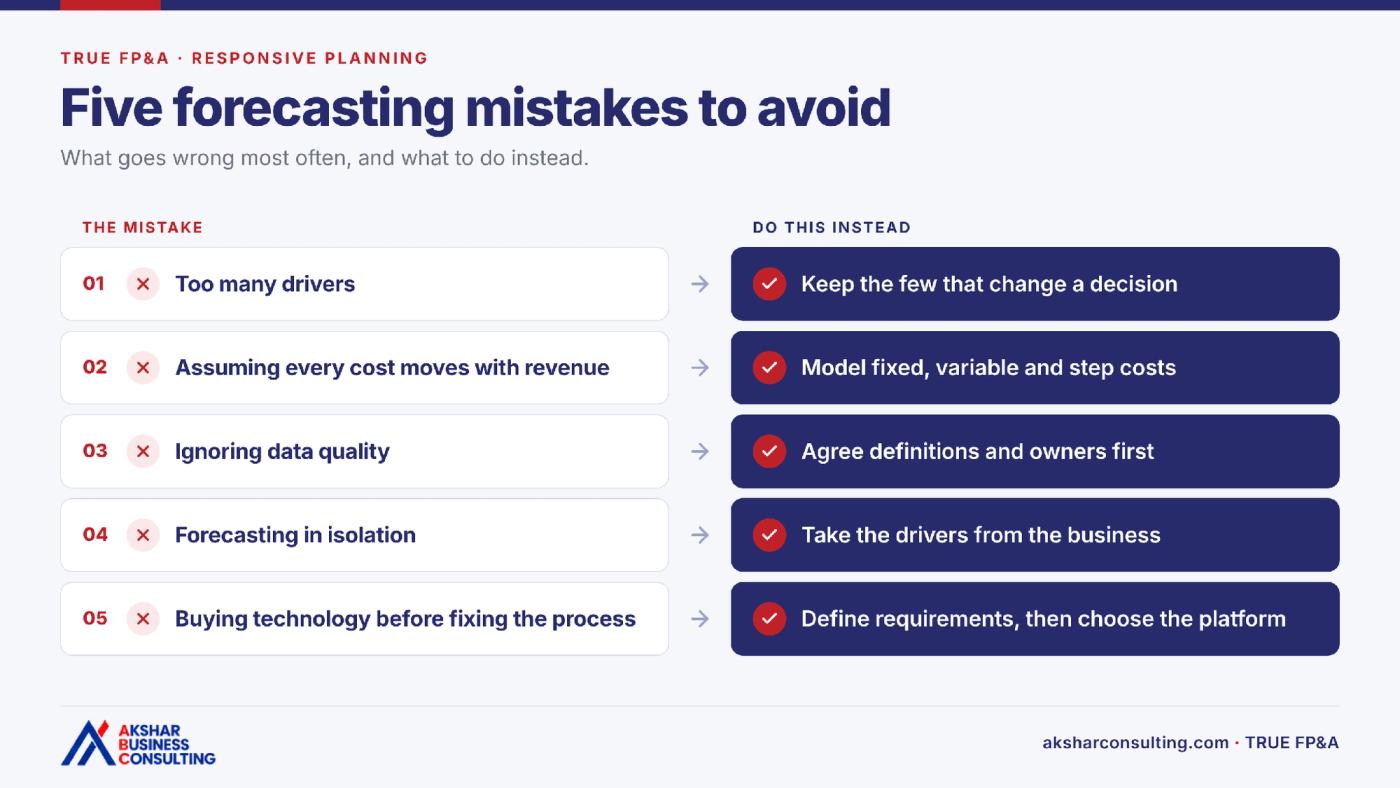
Too many drivers. More detail does not mean better decisions. A model with two hundred drivers rarely survives its second quarter. Focus on what changes the decision.
Assuming every cost moves with revenue. Some costs scale with volume. Others are fixed, or step up only when activity crosses a threshold. Linking everything to revenue is convenient, and it is wrong.
Ignoring data quality. Inconsistent definitions, missing history and unclear ownership will undermine even an elegant model. Fix the inputs before adding sophistication.
Forecasting in isolation. A model Finance builds alone ends up holding Finance's guesses about Operations. Gemma Doran, Portfolio CFO at The CFO Centre UK, put it well on the FP&A Unboxed podcast:
“Driver-based planning has to be collaborative. It's not top-down or bottom-up. It's across. The drivers have to come from within the business.”
Gemma Doran · Portfolio CFO, The CFO Centre UK · FP&A Unboxed
Buying technology before fixing the process. Planning platforms do valuable things: connected calculations, workflow, fast scenarios. They do not decide who owns an assumption or what a driver means. Define the requirements first, then choose the platform, if you need one at all. I wrote more about this in Power BI or a planning platform: the tool is the last decision.
Where driver-based forecasting fits
A driver-based forecast is one part of a wider capability. It needs data it can trust underneath it, reporting that shows what changed, and a finance team in the room when the decision is made.
That is the standard we build to at Akshar Business Consulting. We call it TRUE FP&A:
- Trusted Data: numbers that can be traced, defended and trusted
- Responsive Planning: scenario answers while the question still matters
- Up-to-date Insights: decision-ready insight before the window to act closes
- Engaged Decision Support: KPIs tied to the value-creation plan and the decisions that move it
The four depend on each other. A driver-based model built on inconsistent data will not earn the board's trust. Clean data without responsive planning still leaves Finance unable to answer the next what-if.
Driver-based forecasting sits in Responsive Planning. Our Responsive Planning & Scenarios page sets out how we approach it, and the Synamedia case study shows connected planning and reporting in practice. For the governance side, who can change an assumption and who must be told, read The Forecast That Survives the Board. For diagnosing why a forecast cannot flex in the first place, read The First Question I Ask When a Forecast Cannot Flex.
What I have come to think
A forecast is usually judged by how close it lands. I think it should be judged by how well it explains itself.
A forecast that lands within 2% but cannot say why got lucky. One that misses by 5% but shows exactly which driver moved, who owns it and what the business is doing about it is a management tool. Boards can tell the difference.
If you want to see where your own function sits, the TRUE FP&A Assessment takes about five minutes and gives you a scored view of your strengths and gaps.
Which is hardest in your forecast right now: choosing the drivers, trusting the data behind them, or getting the business to own them?